Organizing and program analysis
When we launched the learning cohort we set two broad questions of inquiry for the first year:
- Who are our people?
- What are they doing?
These are fundamental questions groups who are building power by organizing bases of people have to answer every day.
Who are our members?
The first project we did with the learning cohort groups in the summer of 2020 was to help them analyze their member lists to understand more about their base. Doing this project across groups we found overrepresentation of white women, which is partly due to voter file match rates, but was also surprising to many groups of predominantly Black or Latinx membership.
LUCHA | Membership demographics
CONGRESO event participants by race
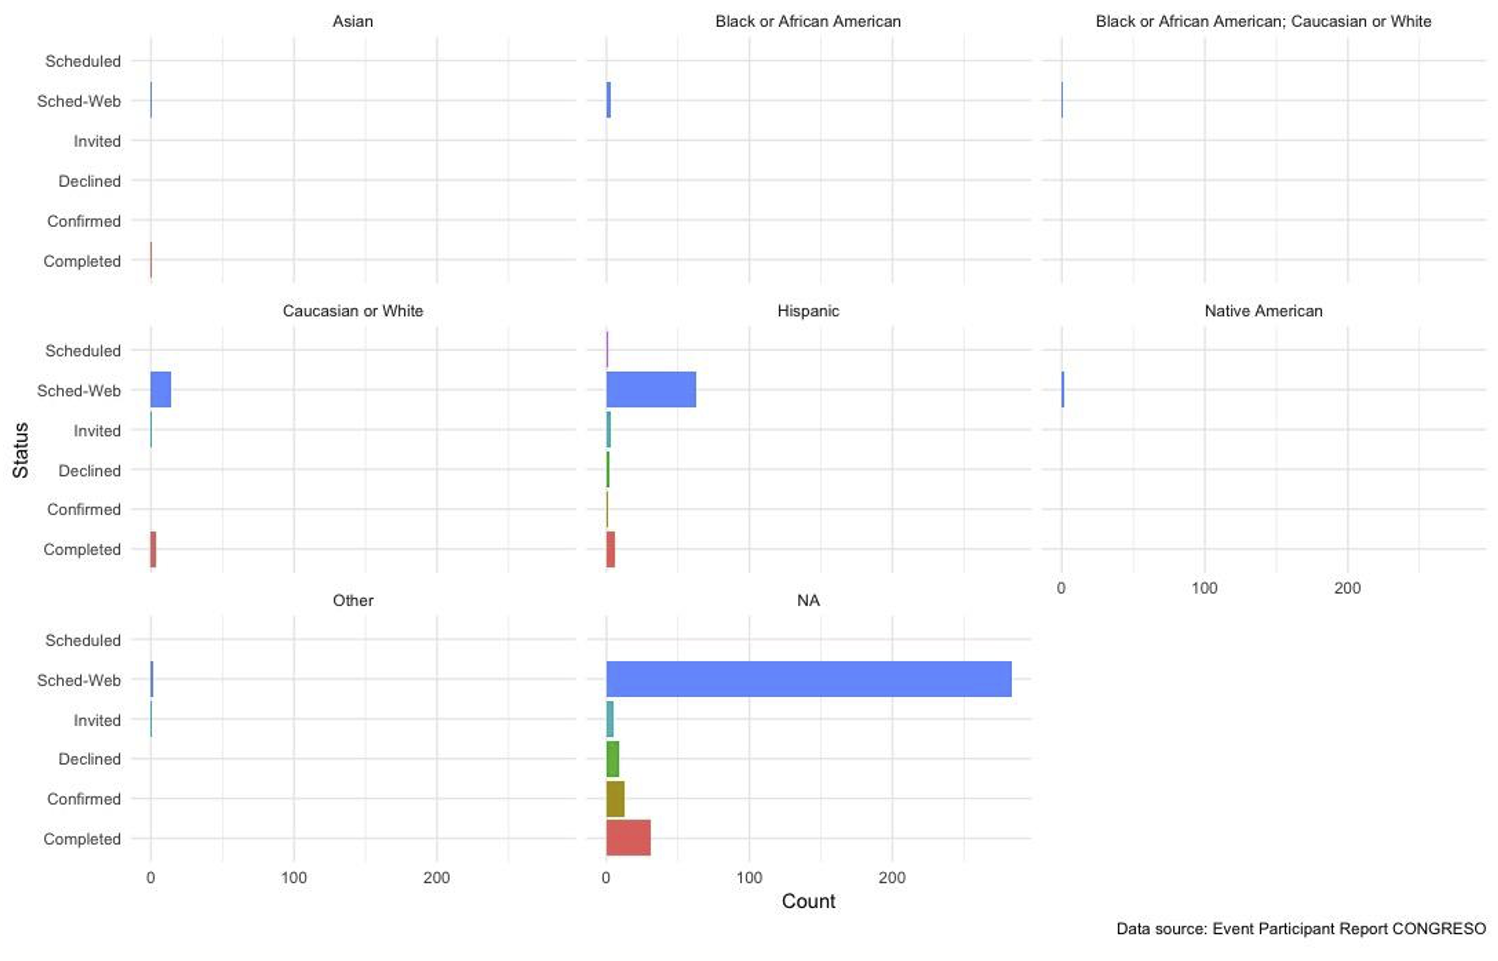
This is a chart from LUCHA that’s similar to most other groups’ membership analysies. It shows that as they’re building their member lists through event sign-ups, they’re not collecting data about race. The majority of groups don’t yet have race/gender/age data about their members. Poor matching to the voter file (12-25% rate earlier this year) meant they couldn’t go that route to filll in missing demographic information. And Every Action has an extensive list of possible codes (something like 15 for gender alone), which is off-putting for data collection. Through the data managers’ monthly cohort meetings, we’ve coached people on setting up event sign-up forms to include the basic demographic info they’d like to collect.
LUCHA | Matching membership to the VAN
Age and race of successful Voter File matches
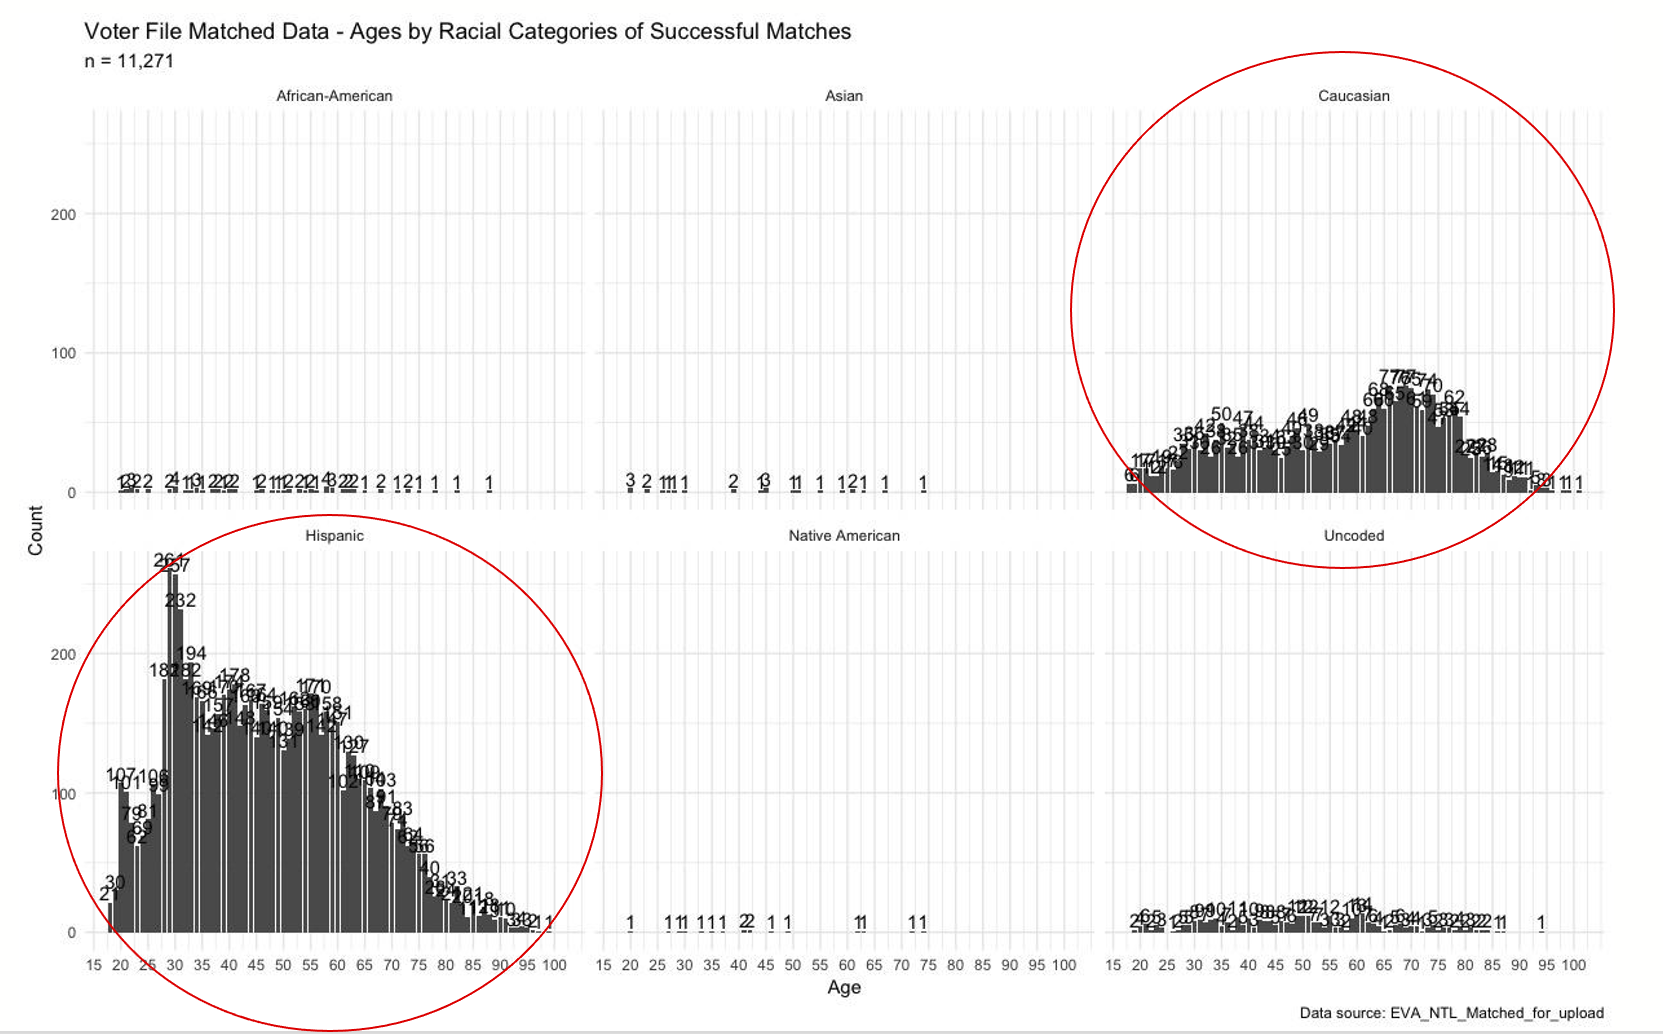
This is another LUCHA chart showing counts of members matched to the VAN by age and race. It shows that for LUCHA, their Latinx members skew much younger, and their white members skew much older.
New Georgia Project | Membership demographics
Race, gender, and age demographics of NGP members
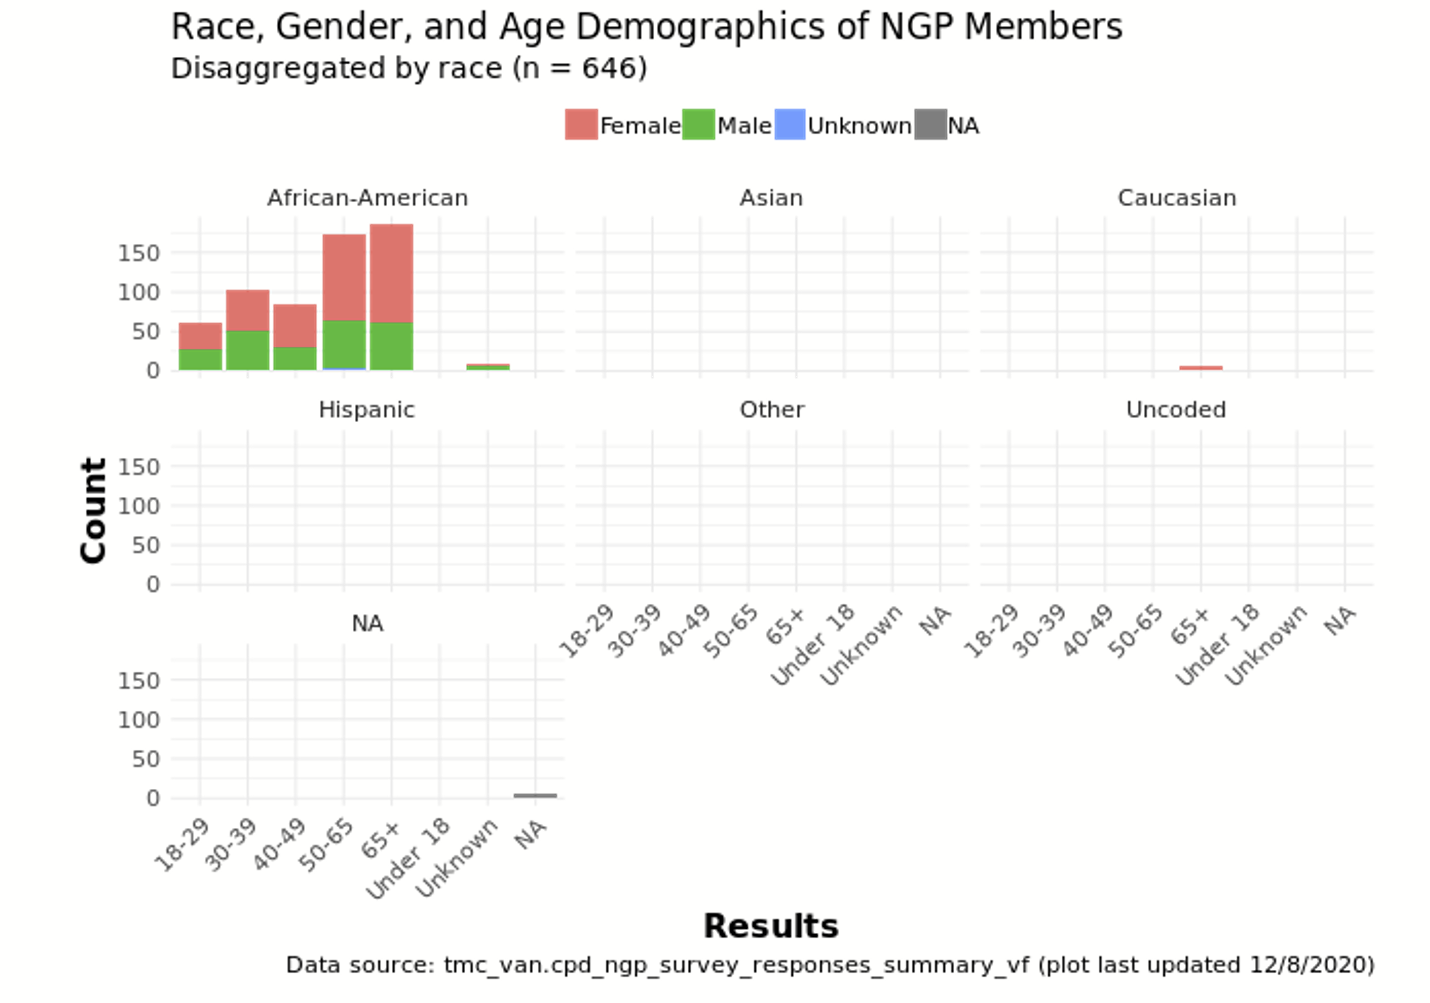
One of the exceptions to the “white woman surprise” was the New Georgia Project, where they started tracking membership in 2020 and used their voter outreach work to build membership. The majority of their new members are middle to older age Black women.
What are our members doing?
Ohio Organizing Collaborative | Member activity dashboard
Event activity of volunteer leaders by organizer
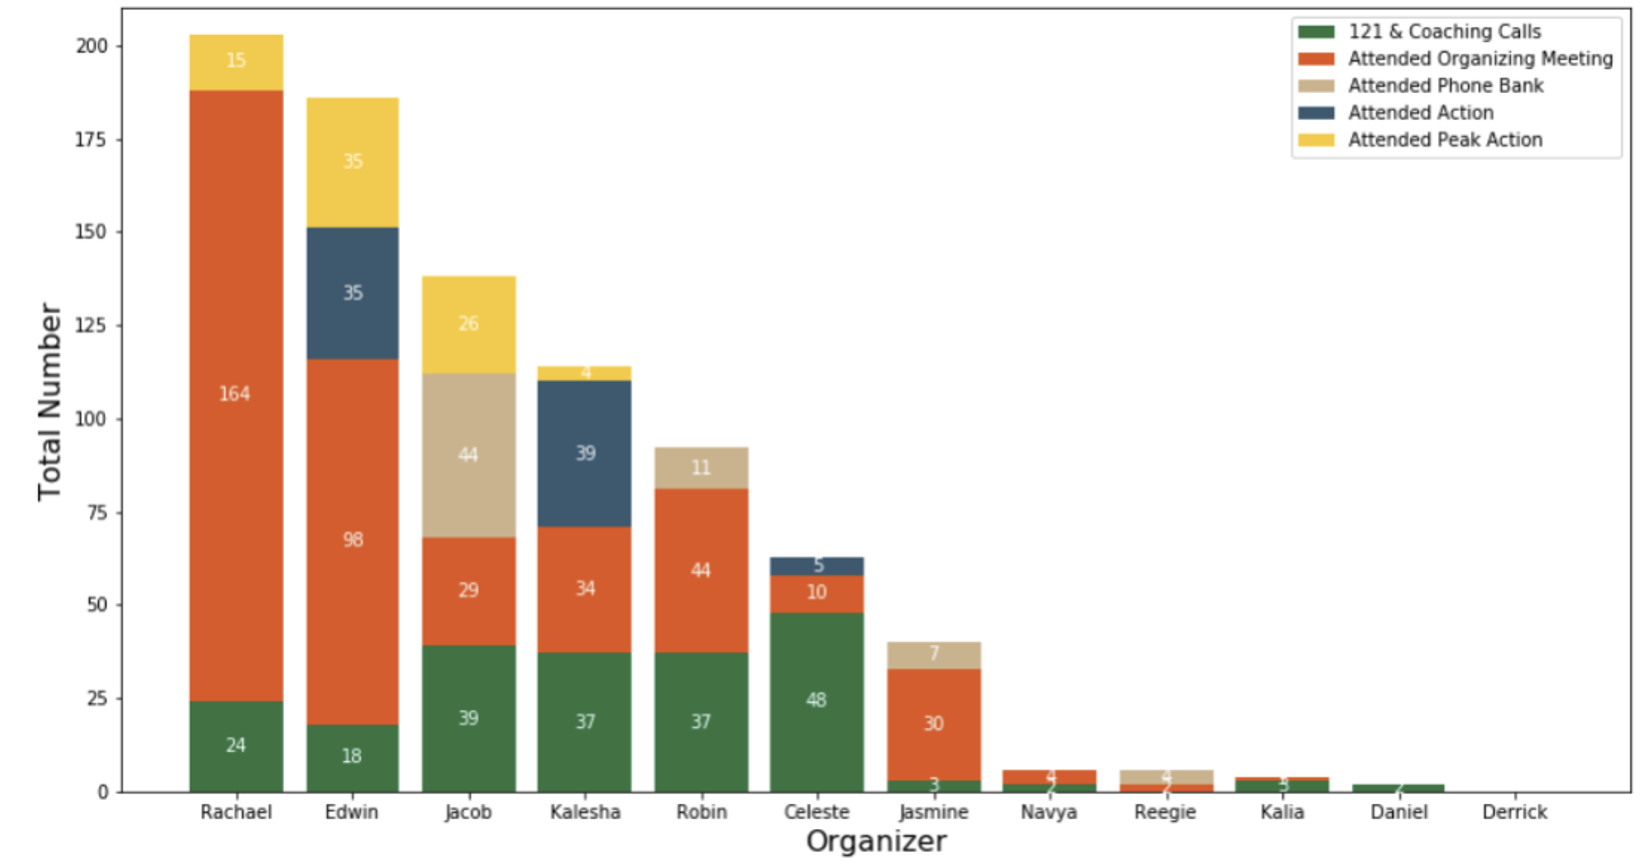
This dashboard captures event data from the first three weeks of October as entered by organizers. The value of this dashboard is that it was built from Google Sheet data, which was easy for most organizers to use daily. Tianyi taught Derrick, the OOC data manager, to run this report weekly for use in organizer staff meetings. It helped the organizers’ managers see where each person was spending their recruitment time, and where they needed to grow. It also helped them see which organizers needed to do more data entry.
Ohio Organizing Collaborative | Member capacity
Bubble chart of volunteers weighted by actions taken
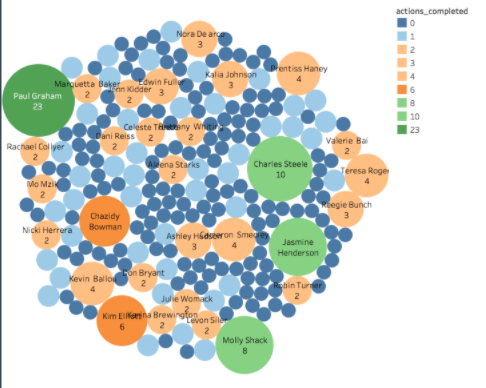
This is another visualization of similar data, but instead of using the organizer as the analysis category, it weights individual members by the number of actions there were reported to have taken. Over time, the OOC saw more bubbles increase in size and turn from blue to orange to green as the number of actions members took increased throughout the election cycle.
Maine People’s Alliance | Event participant report
Count of reported participations by event type
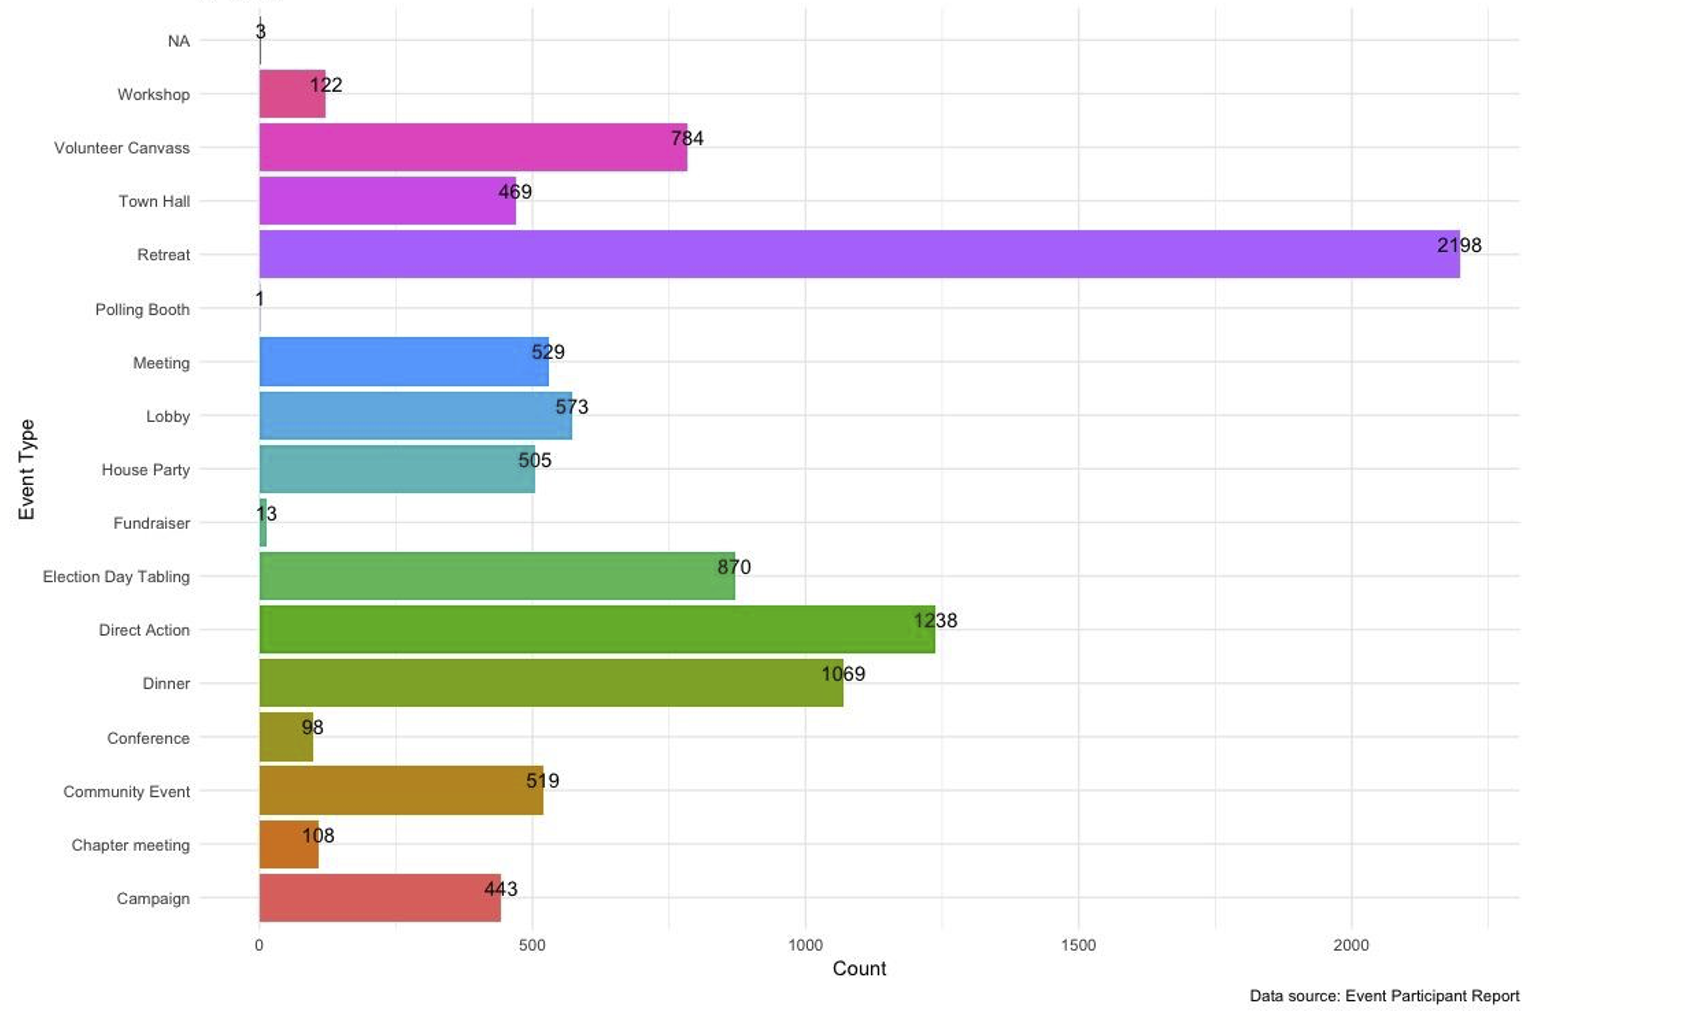
This chart from MPA that shows they were great at collecting data for members who joined retreats, but need to work on building a data culture for organizers to enter data around all other types of events. We’re working with groups to simplify their event types to capture more data in a basic organizing framework of: one-to-ones, small group meetings, trainings, public actions and voter contact events.
Detroit Action | Text banking activity
Snapshot of text program dashboard
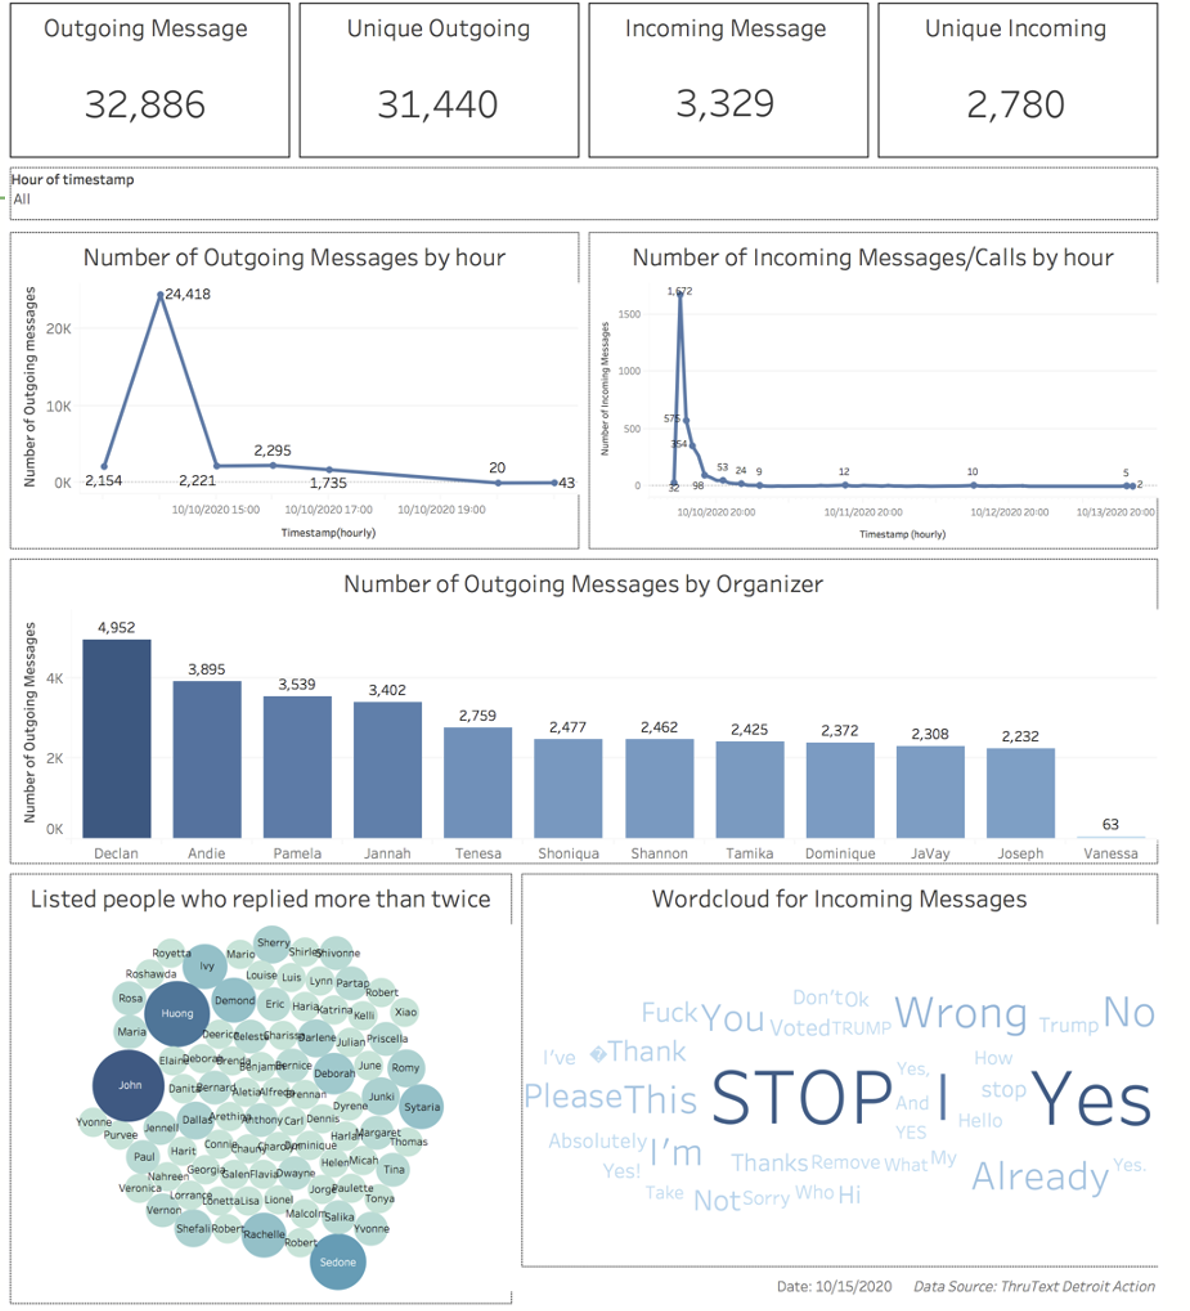
One of the things we worked on in 2020 is helping groups develop dashboards and quick data visualizations like this one from Detroit Action so that they can see who’s doing well, whether their program is working as planned, and promote in program peer learning.